
Spatiotemporal Analysis of Life Expectancy and 20 Causes of Mortality in Metro Vancouver, Canada
High resolution spatial data can help identify and prioritize actions to address health inequalities within cities. The purpose of this study is to quantify neighbourhood indicators of health to measure inequalities in health and identify clusters of cause-specific deaths in Metro Vancouver, Canada.
Approach and Methods
Twenty-seven years (1990–2016) of cause-specific mortality data in Metro Vancouver were linked to three demographic data sources at the census tract level. Bayesian small area estimation models were used to estimate life expectancy (LE) at birth and 20 cause-specific mortality rates by sex and year.
Main Findings
In one of the healthiest cities in Canada, there is significant variation in health across neighbourhoods. The gaps in life expectancy for males and females ranged from 6.9 years to 9.5 years with widening inequality in more recent years.
Some of these variations in life expectancy can be attributed to wide disparities observed of deaths from cancers, cardiovascular diseases, HIV/AIDS and sexually transmitted diseases, and maternal and neonatal disorders. Among cancers, stark neighbourhood disparities were observed of deaths from prostate cancer. For some causes, there was more than a seventeen-fold difference in mortality rate across neighbourhoods.
Interactive Tool
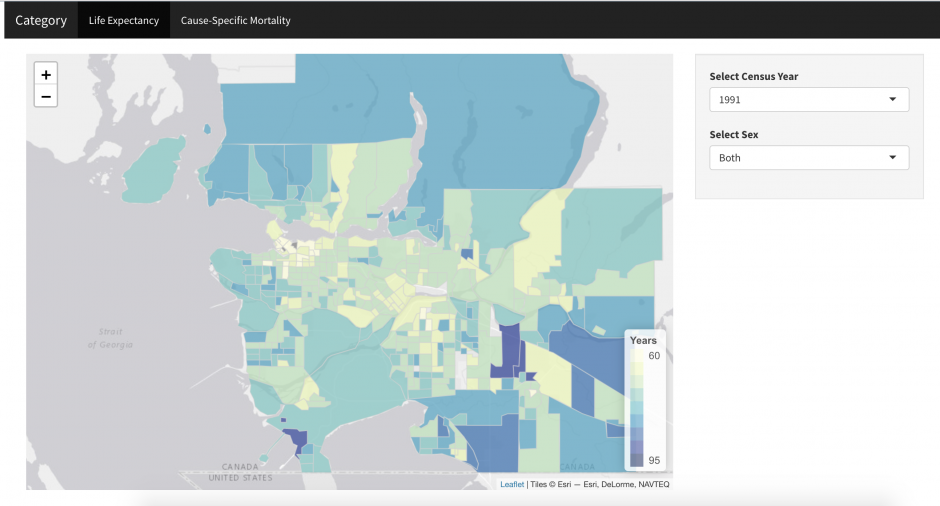
An interactive map providing a spatial representation of the results can be found here.
Published Data Files
All data files used in the generation of these maps can be downloaded here. Note that all use of these data should cite:
Yu J, Dwyer-Lindgren L, Bennett J, Ezzati M, Gustafson P, Tran M, Brauer M. A spatiotemporal analysis of inequalities in life expectancy and 20 causes of mortality in sub-neighbourhoods of Metro Vancouver, British Columbia, Canada, 1990–2016. Health and Place In press.